Profile Plot
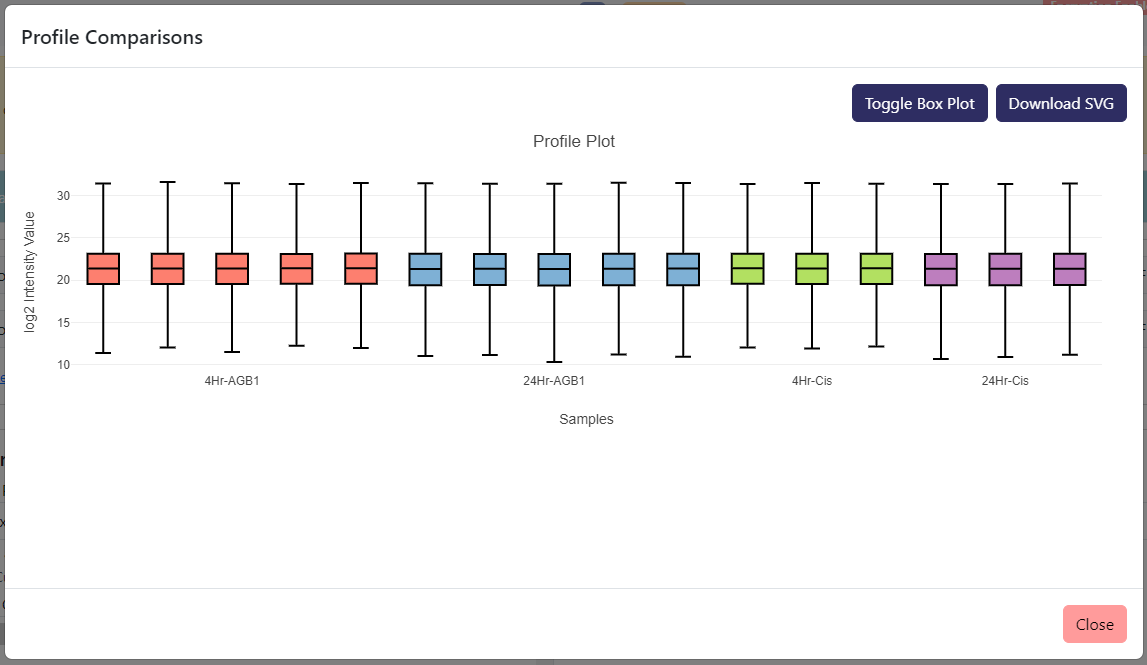
For proteomics, profile plot is a set of box plots that summarizes the relative intensity of all protein within each samples.
In order to access the profile plot, you can go Plot-> Profile Plot.

The above is an example of a profile plot with no protein selected.
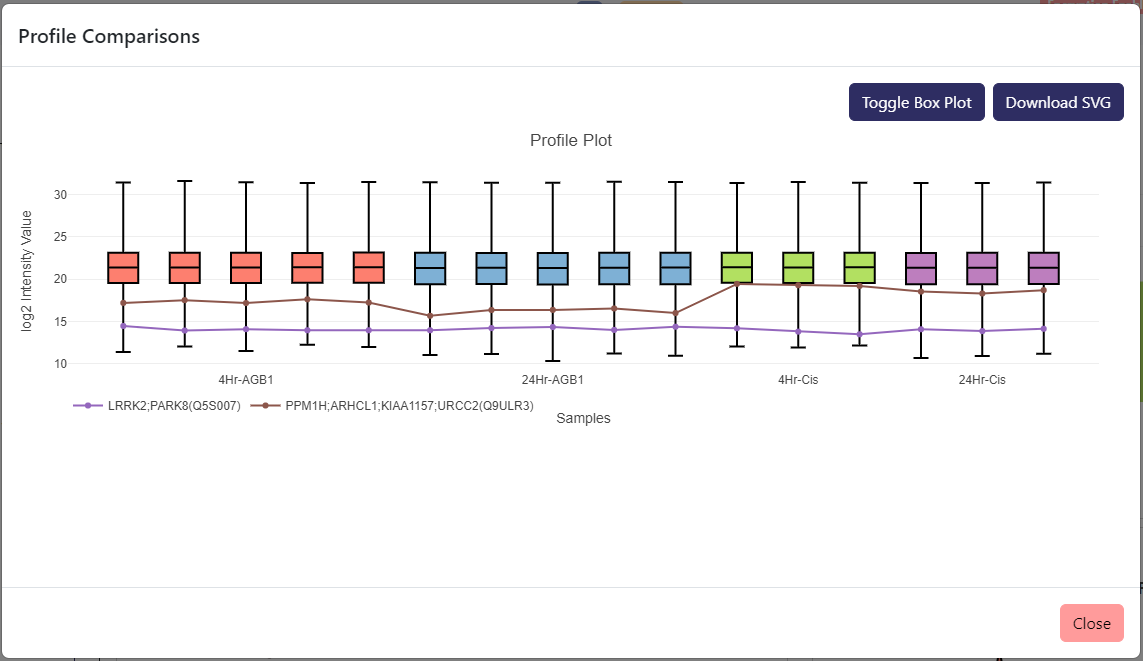
In order to follow the relative intensity of a particular protein, you can tick the Include in profile comparison checkbox associated with the protein under its protein card.

In the example above, we have 2 proteins selected to be included in the profile plot in the form of line charts, LRRK2 and PPM1H. If you do not want to include the box plot, you can click Toggle Box Plot to hide or unhide the box plot on the profile plot.
Last modified: 13 January 2024