Protein Card
Each selected protein will have a protein card section associated with it. This would generally contain data such as UniProt subcelluar location, gene names, primary ids, uniprot accession ids, selection group, and the sample data associated with the protein.
Total Proteomics
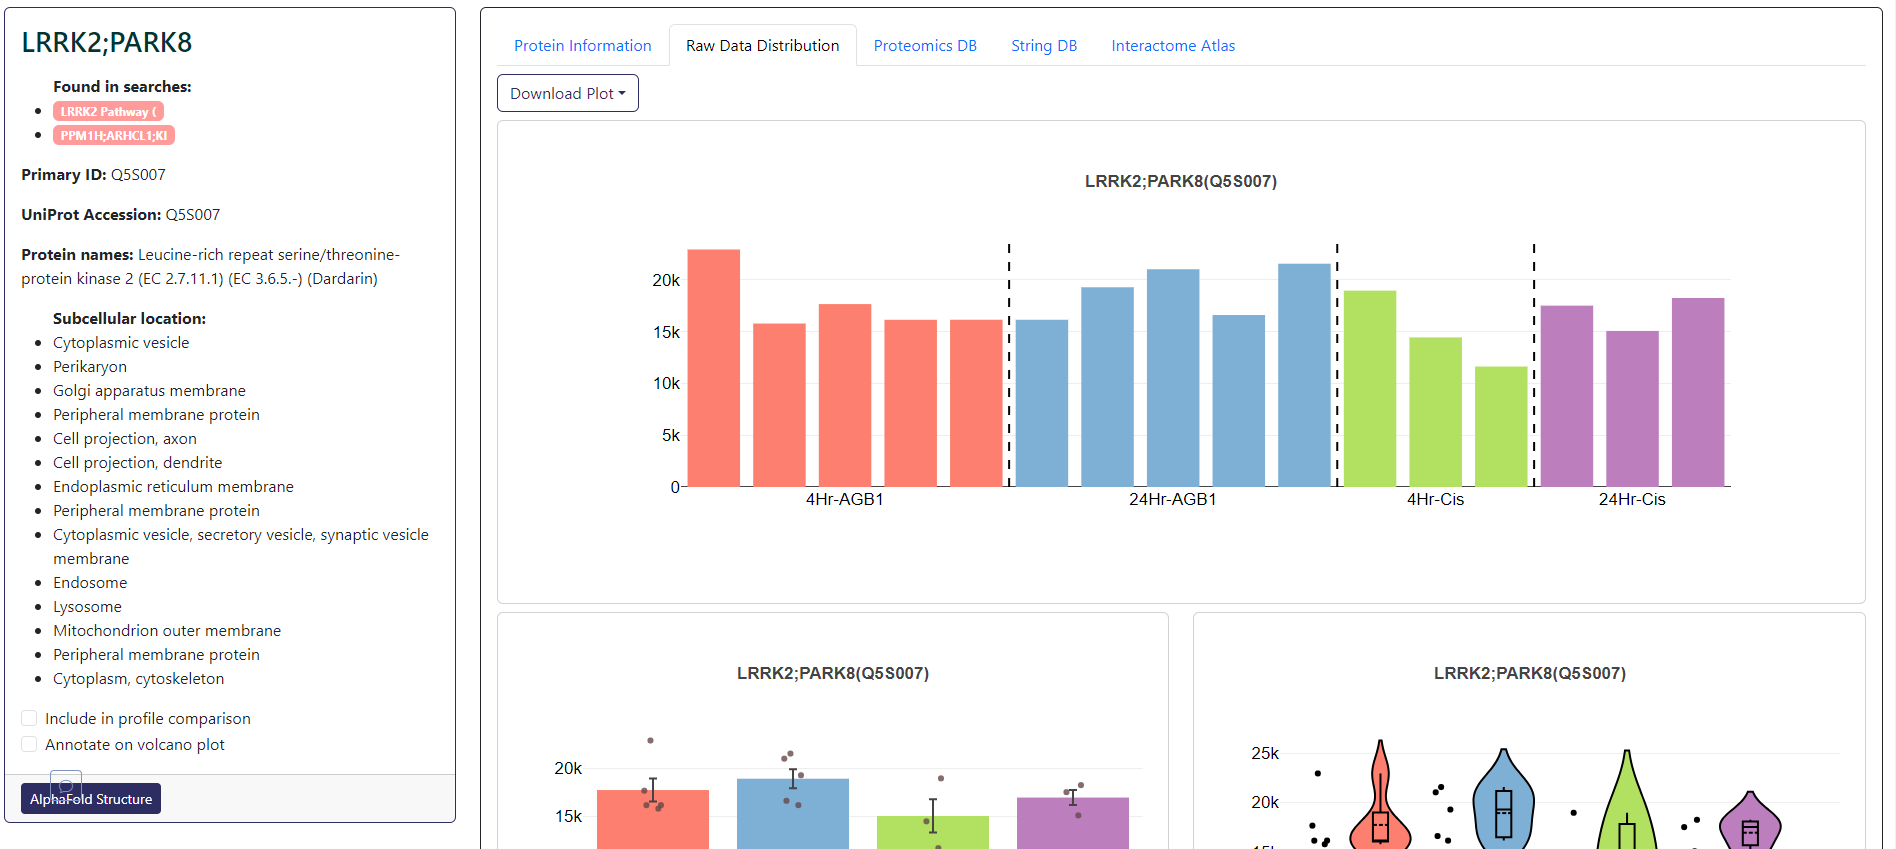
The protein card for total proteomics will allow you to add or remove the selected protein from volcano plot annotation or profile plot. Within this card section, you can also view the bar charts and violin plots of the protein across all samples in the Raw Data Distribution tab and aggregated protein data from UniProt in Protein Information tab. This would includes functional description, functional domains, involvement in diseases, mutagenesis, and pharmacological usage. Further expression data from the knowledgebase can be viewed in the ProteomicsDB tab. Potential interaction data can be found in the StringDB and Interactome Atlas tab.
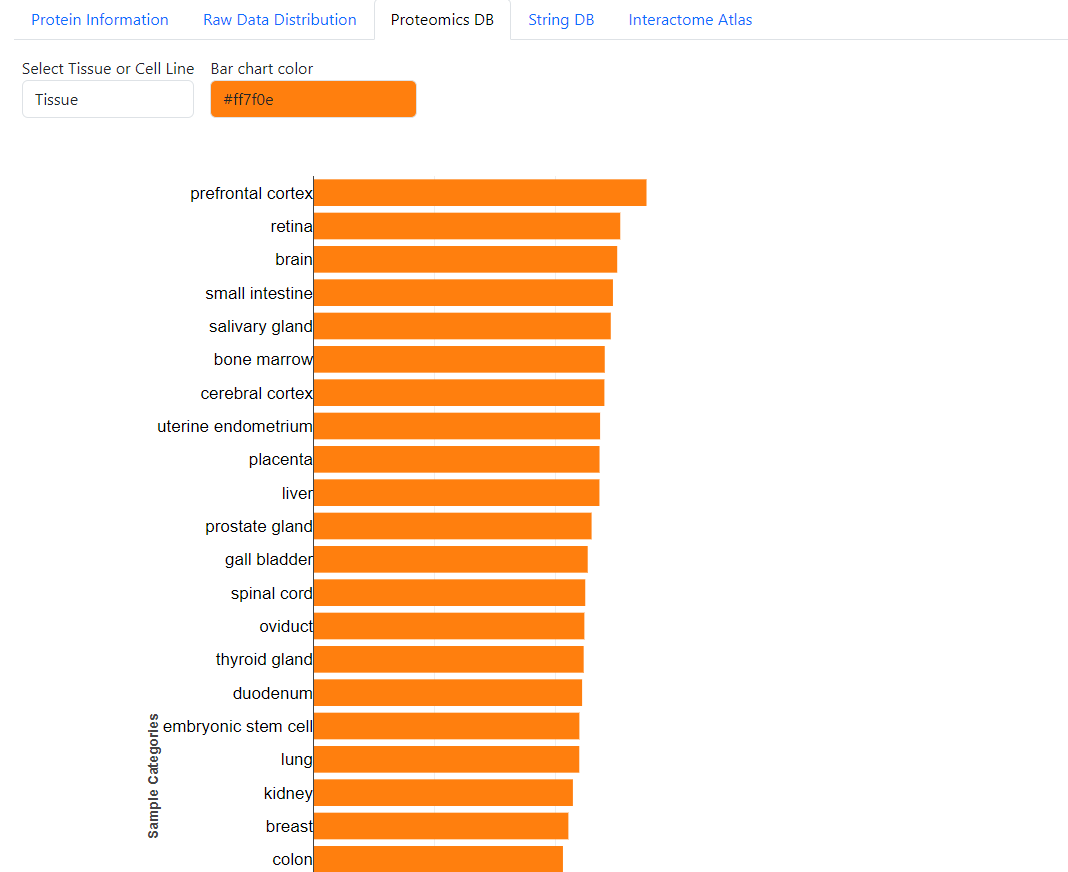
Example of ProteomicsDB tab. Here you can find the expression data from ProteomicsDB for the selected protein. You can select to see the data for different Tissue or Cell line and change the color of the bar chart.
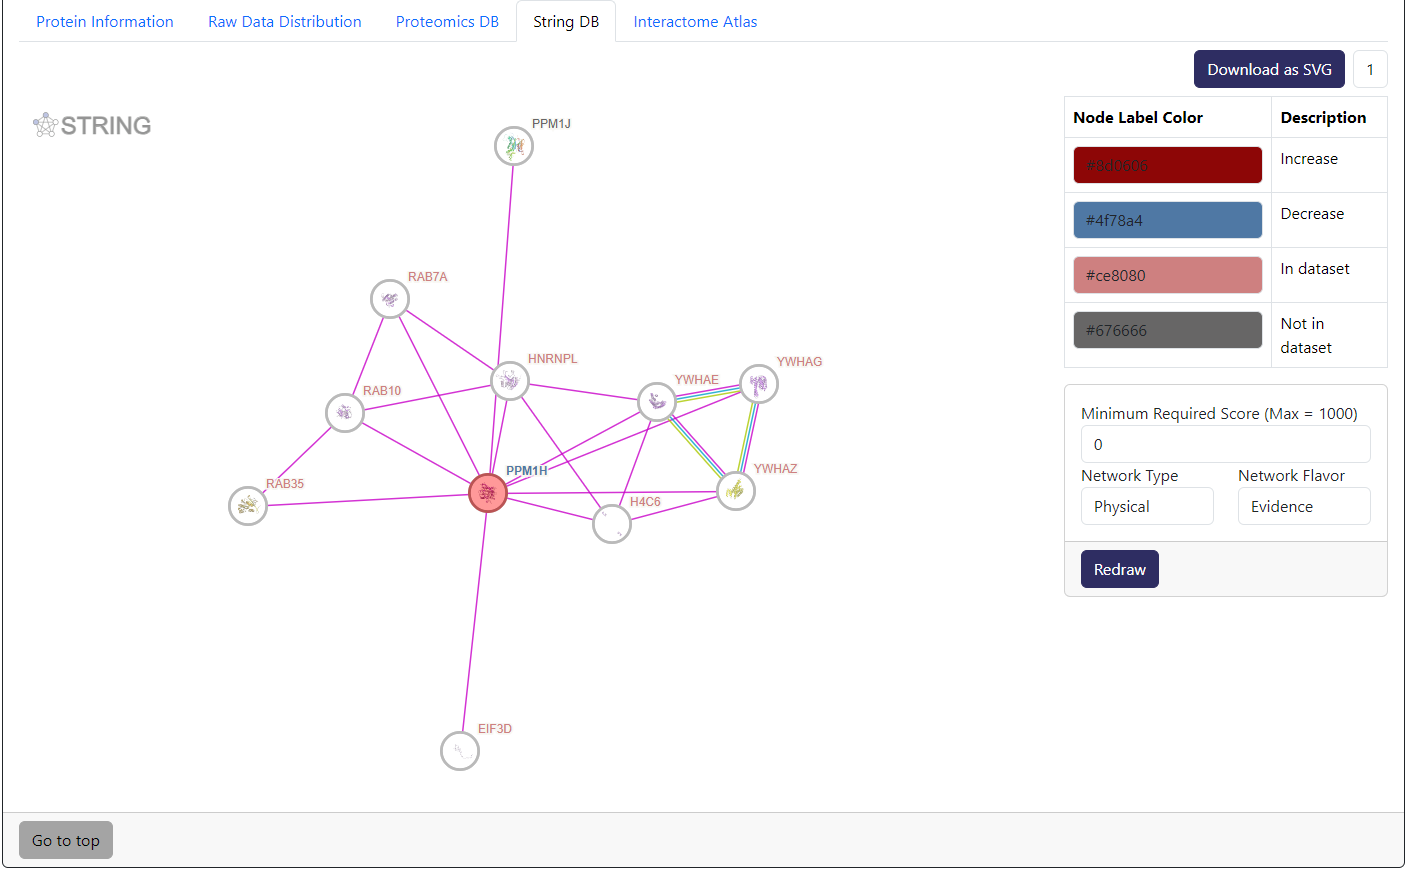
Example of StringDB tab. This is an embedded interaction network from StringDB of the selected protein and its most immediate interactors according to the score cutoff. Here, we also combine the information from differential analysis data to show which potential interactors are significantly changed.
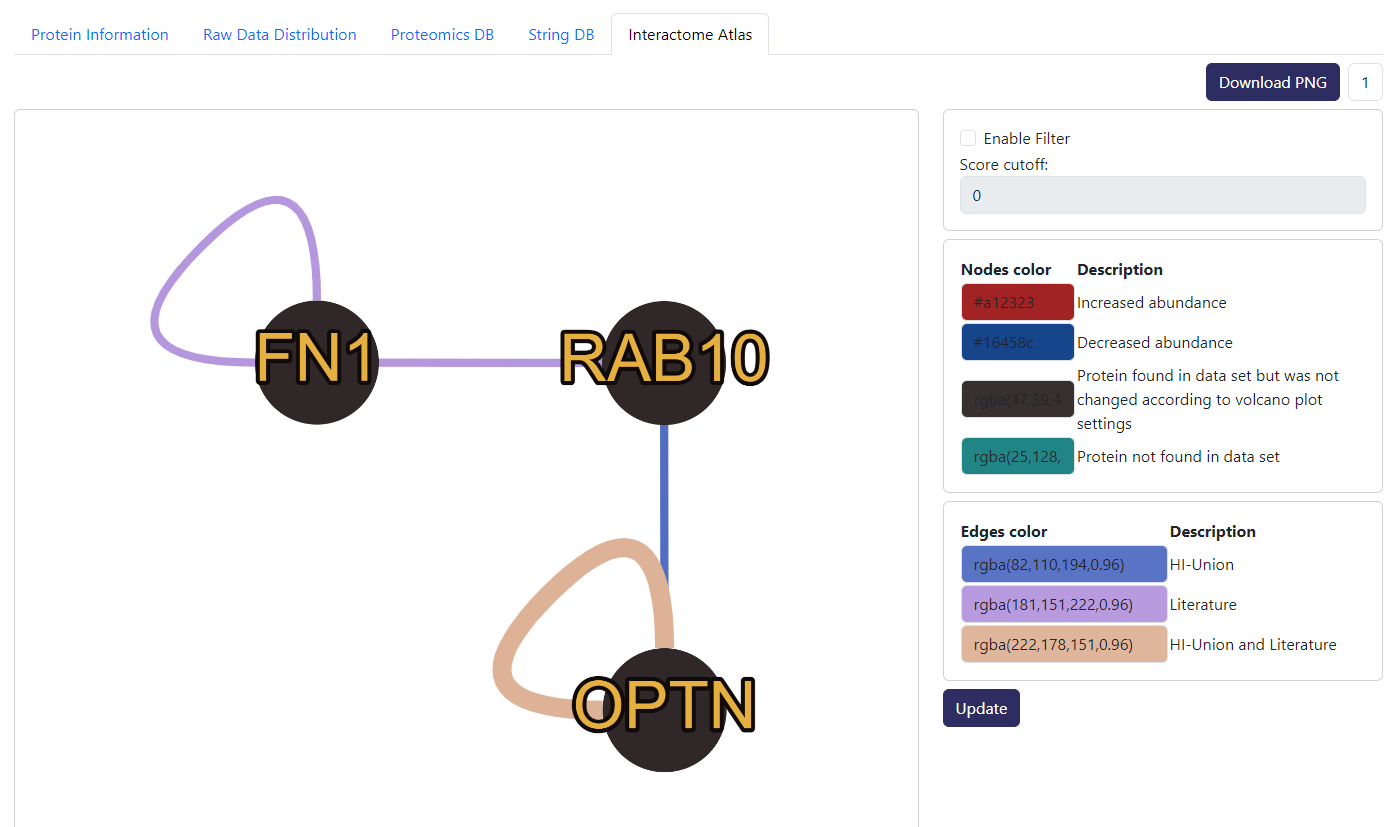
Example of Interactome Atlas tab. Similar to StringDB, this is an interaction network but from Interactome Atlas. Here, we also combine the information from differential analysis data to show which potential interactors are significantly changed.
PTM Proteomics

The protein card for PTM proteomics will also allow you to add or remove the selected PTM from volcano plot annotation or profile plot (under A button action). Different to total proteomics, the protein card for PTM proteomics will also display the PTM sites found in the data on the left under the subcellular location section as well as in the main card in the Raw Data Distribution tab. If the PTM site has been selected in any selection group, it will be highlighted with a green background color. In the main card, you will also find a table where you can find the primary ids (UID), amino acid residue, PTM site position in peptide, fold change, significance, sequence window, peptide sequence, and localization score parsed from the submitted data. The direct residue of the PTM site within the sequence window and peptide sequence is also highlighted in red.
Beside the Raw Data Distribution tab, you can also find the Protein Information tab which contains the aggregated protein data from UniProt. This would includes functional description, functional domains, involvement in diseases, mutagenesis, and pharmacological usage. For PTM knowledgebase, you can find the PTM Position Viewer tab which construct several linear plots with overlaying PTM sites information from the submitted data, UniProt, PhosphoSitePlus and more.
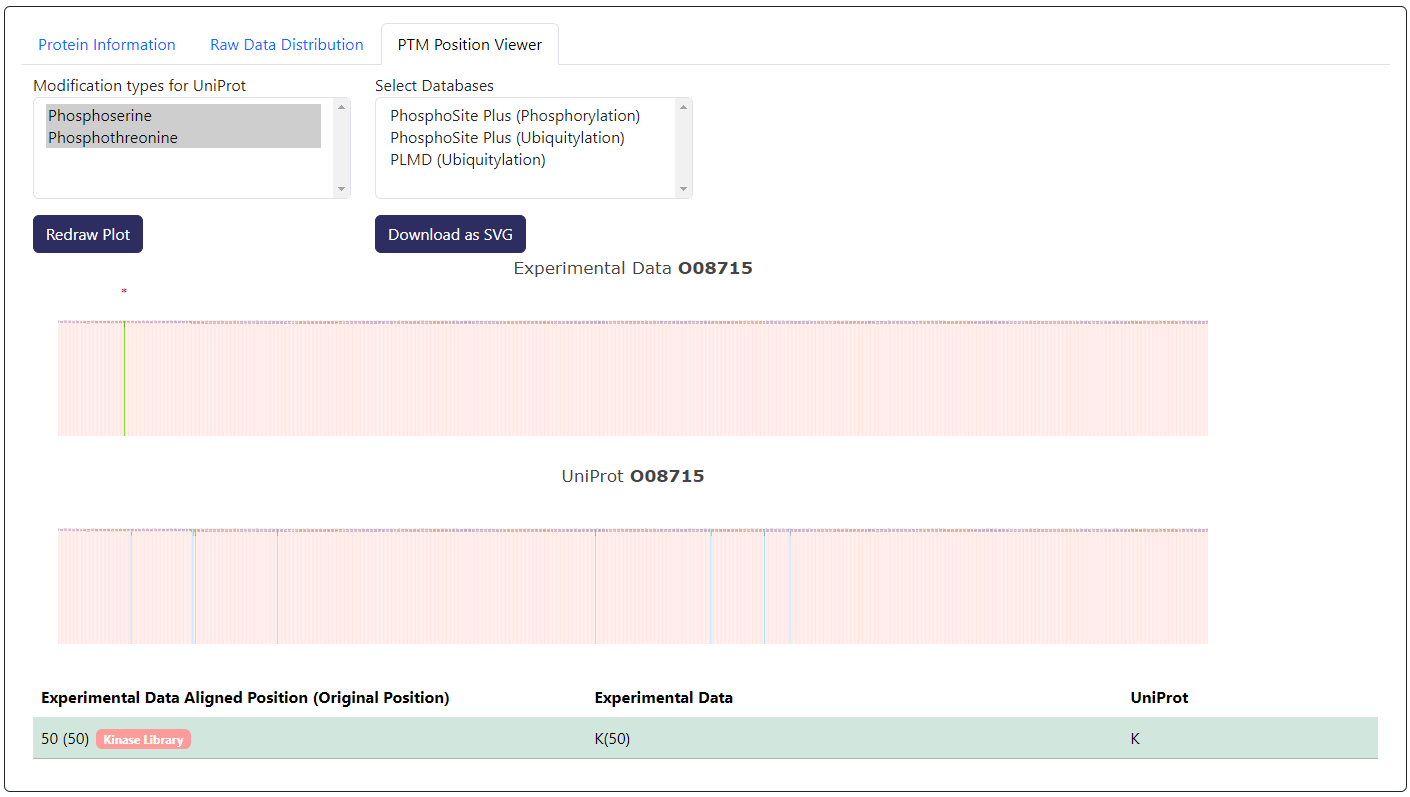
In the example above, we are showing the PTM Position Viewer tab of an example with Ubiquitylation data. Here you can select different isoforms of the viewing protein and CurtainPTM would perform multiple sequence alignment with all the viewing isoforms.
On the experimental data section of the
PTM Position Viewer, sites that have been selected will appear as green. Sites that have not been selected will appear as red. Sites that are significantly changed based on the differential analysis will have an asterisk on top.On the knowledgebase section (third party databases), sites that overlap with the experimental data will appear as green. Sites that do not overlap with the experimental data will appear as purple. Those that do not overlap with the experimental data appear as blue.
By default, only UniProt and experimental data is shown. You can select more databases to be shown in the
Select Databasesbox.At the bottom, you can find a table with aligned position data from the plot. In the first column
Experimental Data Aligned Position (Original Position), the position from the multiple sequence alignment of the user's experimental PTM sites while the original position is shown within the()next to it.If the site is a potential phosphorylation site, you can click on
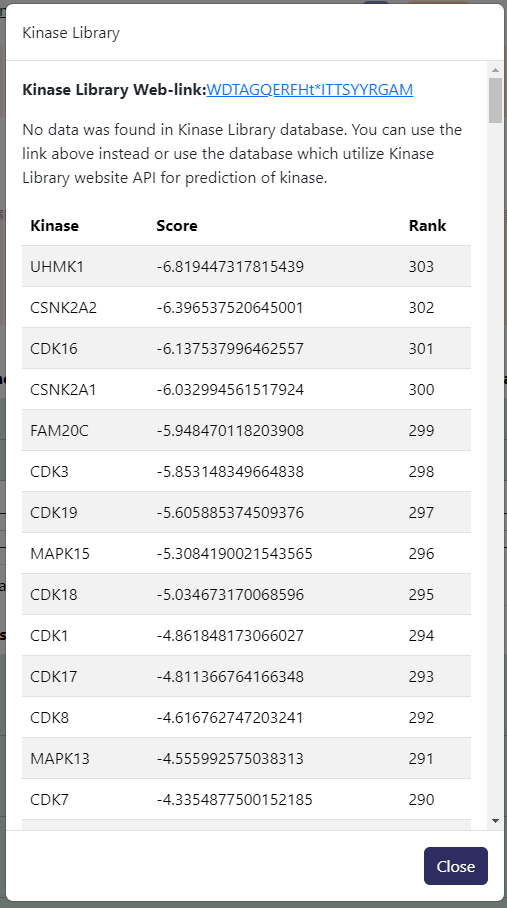
Kinase Librarybadge in red next to the experimental site in the table to see potential kinases prediction provided byKinase Libraryhosted byPhosphoSitePlus. You can click on the hyperlinked sequence in the interface to get more detail fromKinase Library. Example output below.
